Taiwan stock market data, visualized.
JerryCloud builds dashboards that turn Taiwan equity market data into clear charts — price and volume, institutional flows, monthly revenue, and broker research — so a trader can see the facts at a glance.
台股資料視覺化工具:把價量、法人籌碼、月營收與券商研究整理成一眼看得懂的圖表。
What it shows
Price & volume
Daily and intraday candles, moving averages, KD/MACD indicators, volume vs. average.
Institutional flows
Foreign investor, investment trust and dealer net buy/sell, plus active-ETF holdings changes.
Fundamentals
Monthly revenue YoY/MoM, cumulative revenue trends, margin direction.
Research digest
Summaries of newly published broker research reports, organized by stock and sector.
Screenshots
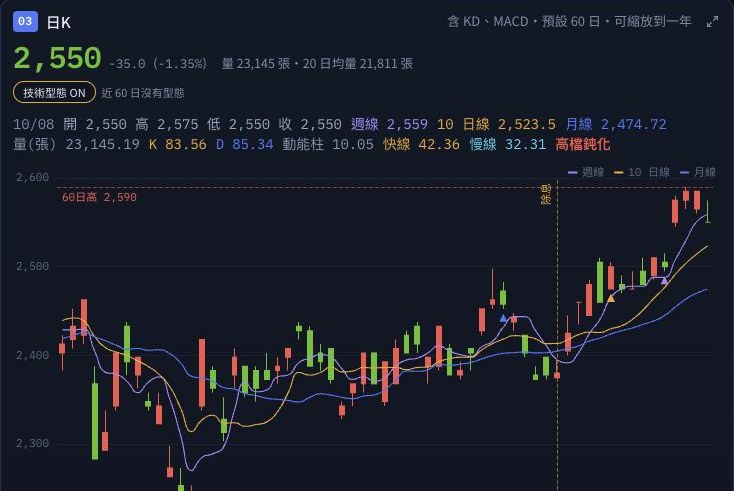
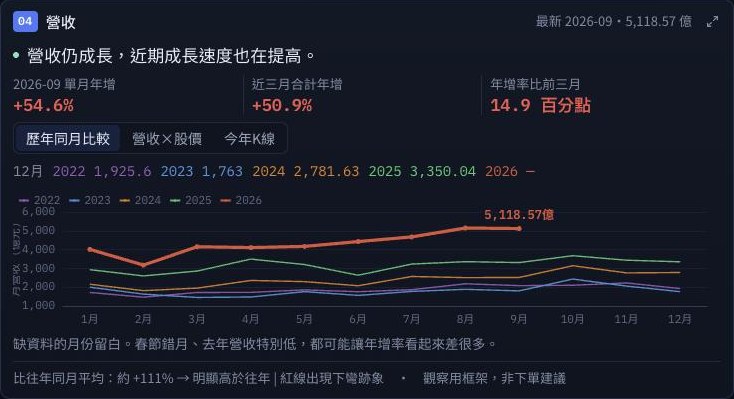
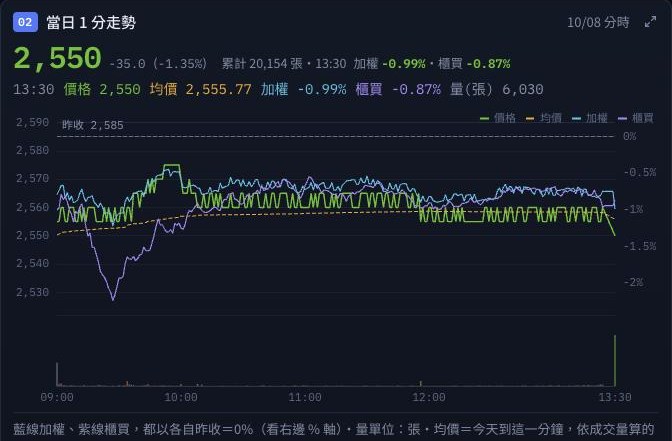
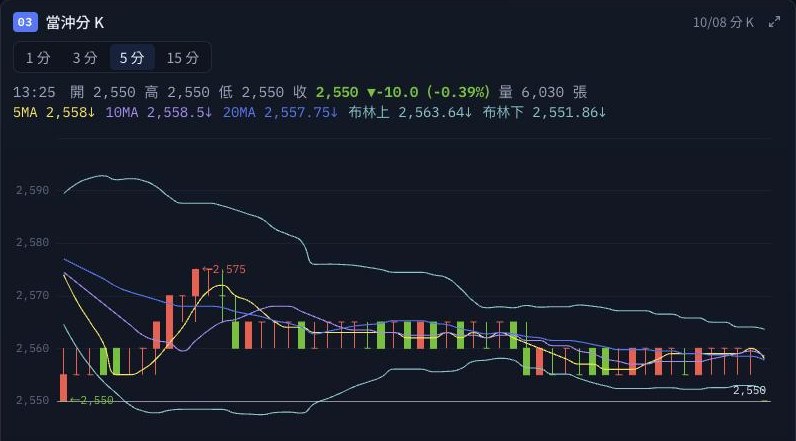
畫面為實際系統截圖(台積電 2330,2026/10/08 資料)。
How it's built
- Data pipeline collecting official exchange (TWSE/TPEx) and licensed market data into PostgreSQL.
- Document pipeline that parses broker research PDFs and indexes them for retrieval (RAG).
- LLMs summarize long research documents and structure data; agentic coding speeds up pipeline development.
Scope
JerryCloud presents data and charts only. It does not provide investment advice, recommendations, or brokerage services.
本服務僅呈現資料與圖表,不構成任何投資建議。